6.10. Chart
Earlier, we designed FactDisclosePanel and ChartPanel but stopped
short of completing the actual charts as it may be difficult to grasp at
that stage. In this chapter, we are going to complete it and display
charts using Google Chart Tools also known as Google Visualization.
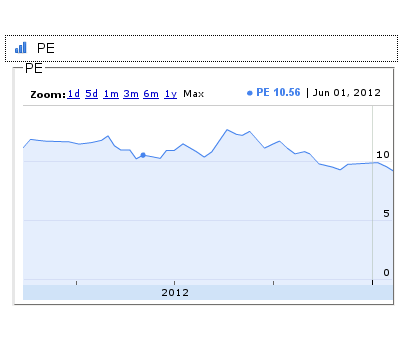
Figure 6.16. Chart
Install Google Chart Tools
GWT SDK doesn’t ship with Chart module, and we have to download and add Google Chart Tools module to the project.
Download gwt-visualization-<<version>>.zip file from
Downloads
and unzip the package and copy gwt-visualization-<<version>>.jar to
war/WEB-INF/lib dir. Next, add the jar to project build path. Select
and right click the war/WEB-INF/lib/gwt-visualization.jar and in the
context menu choose Build Path → Add to Build Path to add the
library to the project build path.
Before going further. familiarize yourself with Google Chart Tool through Getting Started Guide
To use Chart Tool, inherit the module in fins.gwt.xml file with following line.
in.fins/fins.gwt.xml
<inherits name="com.google.gwt.visualization.Visualization" />
In the half finished ChartPanel, we used DataGroupAction to fetch
data for a category for all dates available in datastore. For example,
to draw Price chart we fetch DataGroup for Quote category that
contains Price facts for all dates.
Once DataGroupAction fetches DataGroup, it fires DataGroupEvent
which is handled by onDataGroupChange() method, but it is not possible
to draw the chart in this method Reason being, to load the Google Chart
Tools API module, we have to invoke the Google Ajax Loader with a
callback method, and in the call back method, we have to add the code
that is required to create the chart. Once Chart API is loaded, that
happens asynchronously, loader executes the callback method to create
and display the chart.
in.fins.client.widget/ChartPanel.java
        public ChartPanel(String title, String key, String chartWidth,
                        String chartHeight, boolean rangeSelector) {
                this.title = title;
                this.key = key;
                this.width = chartWidth;
                this.height = chartHeight;
                this.rangeSelector = rangeSelector;

                sPanel = new SimplePanel();
                initWidget(sPanel);

                onLoadCallback = new Runnable() {
                        public void run() {
                                AnnotatedTimeLine chart =
                                      new AnnotatedTimeLine(createTable(),
                                                createOptions(), width, height);
                                log.fine("Chart created");
                                sPanel.setWidget(chart);
                        }
                };
        }
Call back method, onLoadCallBack() is a Java Runnable object that runs
in a separate thread and in its run method we create the chart.
in.fins.client.widget/ChartPanel.java
        protected Options createOptions() {
                Options options = AnnotatedTimeLine.Options.create();
                options.set("allowRedraw", true);
                options.set("displayExactValues", true);
                options.set("dateFormat", "MMM dd, yyyy");
                options.set("displayRangeSelector", rangeSelector);
                options.set("fill", "20");
                return options;
        }

        private AbstractDataTable createTable() {

                DataTable dataTable = DataTable.create();
                dataTable.addColumn(ColumnType.DATE, "Date");
                dataTable.addColumn(ColumnType.NUMBER, this.title);

                List<Data> dataList = dataGroup.getDataList();
                dataTable.addRows(dataList.size());

                Collections.sort(dataList);
                for (int i = 0; i < dataList.size(); i++) {
                        Data data = dataList.get(i);
                        dataTable.setValue(i, 0, data.getDate());
                        for (Fact fact : data.getFacts()) {
                                if (fact.getKey().equals(key)) {
                                        try {
                                                double value
                                             = Double.parseDouble(fact.getValue());
                                                dataTable.setValue(i, 1, value);
                                        } catch (Exception e) {
                                        }
                                }
                        }
                }
                return dataTable;
       }
Method createOptions() returns Options which are used to configure the
chart. Various configuration options for each Chart type is available in
Chart
Gallery.
Method createTable() returns DataTable of two columns, one for date
and another for the number. This method, traverses List<Data> and sets
the date from each Data to the first column and gets matching fact from
List<Fact> and sets its value to the second column.
Let’s understand how Ajax Loader executes the callback method
onLoadCallback().
in.fins.client.widget/ChartPanel.java
        @Override
        public void onDataGroupChange(DataGroupEvent dataGroupEvent) {
                log.fine("dataGroupEvent received. Load charts ");
                dataGroup = dataGroupEvent.getDataGroup();
                VisualizationUtils.loadVisualizationApi(onLoadCallback,
                                AnnotatedTimeLine.PACKAGE);
        }
In handler method onDataGroupChange(), DataGroup is retrieved from
DataGroupEvent and assigned to dataGroup field. Next, we call
VisualizationUtils loadVisulationApi() method by passing Runnable
object created earlier as callback. VisualizationUtils uses Ajax loader
to load the Visualization API, and after it loads the API, it calls the
runnable object (i.e. onLoadCallBack method) to create the chart.
In the next section, which is the closing section of Part 1 of the book, we take a look at tab closing.