6.9. FactGrid
FactGrid uses GWT DataGrid widget to display the data in a tabular
view. Instead of adding it to Snapshot which already full with widgets,
a GWT PopupPanel comes handy to display more data without forcing the
user to leave the page.
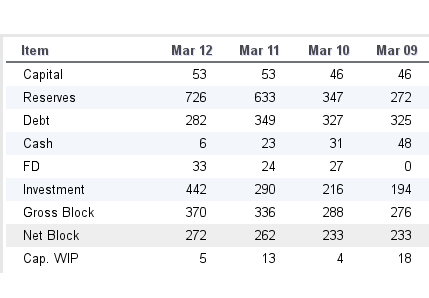
Figure 6.13. FactGrid
Like the CellTable, which we used earlier in FactTable, GWT DataGrid
also displays data in tabular view. Both are subclasses of
AbstractCellTable and supports columns, sorting, paging whereas
DataGrid additionally has a Header, Footer and a scrollable content area
in the center.
Following UI declaration adds pop-up ToolbarItem to FactTable.
in.fins.client.content/Snapshot.ui.xml
       <f:FactTable captionText="Cash Flow" category="Cash Flow">
               <f:ToolbarItem type="previous" category="Cash Flow" />
               <f:ToolbarItem type="popup" category="Cash Flow" />
               <f:ToolbarItem type="next" category="Cash Flow" />
       </f:FactTable>
Unlike, other GWT widgets, PopupPanel is not added to any other panel. Hence, PopupPanel and FactGrid are initialized bit differently than what we have done so far. We add them through code rather than through UiBinder. At any time, only one PopupPanel is visible so we can reuse the single instances of PopupPanel and FactGrid among all pop-up ToolbarItem. Considering these two aspects, we create PopupPanel and FactGrid in the constructor of Snapshot and assign the FactGrid to the field which is shared by pop-up ToolbarItem.
in.fins.client.content/Snapshot.java
       public Snapshot() {
               factGrid = new FactGrid();
               PopupPanel popup = new PopupPanel();
               popup.setGlassEnabled(true);
               popup.setAutoHideEnabled(true);
               popup.add(factGrid);

               initWidget(binder.createAndBindUi(this));
               ....
Methods show() or center() shows the PopupPanel and method hide()
hides it. AutoHideEnabled is set to true so that PopupPanel is hidden
when user clicks area outside the pop-up and with this we avoid hide()
method.
FactGrid is a slightly tweaked DataGrid to handle Facts and these tweaks are to overcome a couple of challenges:
mapping the value methods to DataGrid columns
reorder the data as suitable to DataGrid.
Indexed Column
Following code snippet adds Contact info columns to DataGrid.
                TextColumn<Contact> nameColumn = new TextColumn<Contact>() {
                        @Override
                        public String getValue(Contact contact) {
                                return contact.getName();
                        }
                };

                TextColumn<Contact> addrColumn = new TextColumn<Contact>() {
                        @Override
                        public String getValue(Contact contact) {
                                return contact.getAddress();
                        }
                };
                dataGrid.addColumn(nameColumn);
                dataGrid.addColumn(addrColumn);
Adding columns to DataGrid is easy as long as there are distinct
methods, which returns a value for each column like getName() and
getAddress(). Model can have distinct methods as long as they are few
and well known before hand. In any financial statement, there are a
couple of hundred data points like Captial, Debt, Sales etc., and it is
not feasible to have distinct model class for each of them nor to have
methods like getCapital(), getSales() etc. All data points are
represented by Fact class with getKey() and getValue() methods and
we have to map getValue() method to each and every column of the
DataGrid and IndexColumn class achieves this feat.
in.fins.client.widget/FactGrid.java FactGrid$IndexedColumn.class
class IndexedColumn extends Column<List<Fact>, String> {
        private int index;
        private boolean roundoff;

        public IndexedColumn(int index, HorizontalAlignmentConstant align,
                        boolean sortable, boolean roundoff) {
                super(new TextCell());
                this.index = index;
                setHorizontalAlignment(align);
                this.roundoff = roundoff;
                setSortable(sortable);
        }

        @Override
        public String getValue(List<Fact> facts) {
                if (roundoff) {
                        return facts.get(index).getRoundoff();
                }
                return facts.get(index).getValue();
        }
}
IndexedColumn extends GWT Column and each IndexedColumn holds an
index corresponding to its column position in DataGrid. Column type is
set to List<Fact>, and because of this, overridden method getValue()
gets List<Fact> as input. From the list index gets the Fact
pertaining to that column and its getValue() method returns the value
for the column. Apart from index, constructor also sets other parameters
like align, sortable and roundoff which are useful to customize the
columns. IndexedColumn is a non public class of FactGrid.
Transpose
Even though, IndexedColumn maps List<Fact> to DataGrid columns, List<Fact> corresponds to a row of DataGrid. List<Fact> is collected into another List which is List of List<Fact> or List<List<Fact>> and it is data for all the rows of DataGrid which is rendered as shown in following figure.
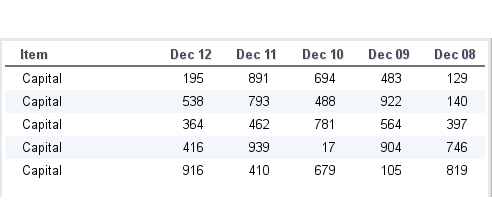
Figure 6.14. FactGrid
Order of multidimensional List is not proper, and we have to flip the
List<List<Fact>> to render it properly. FactGrid.transpose()
method does exactly that.
in.fins.client.widget/FactGrid.java
        public List<List<Fact>> transpose(List<List<Fact>> factsList) {
                if (factsList.size() == 0) {
                        return factsList;
                }

                List<List<Fact>> tList = new ArrayList<List<Fact>>();
                for (int i = 0; i < factsList.get(0).size(); i++) {
                        List<Fact> tFacts = new ArrayList<Fact>();
                        for (List<Fact> facts : factsList) {
                                // facts at index are added to new list
                                tFacts.add(facts.get(i));
                        }
                        tList.add(tFacts);
                }
                return tList;
        }
List<List<Fact>> is traversed and, for each of its List<Fact>, index is held in variable i. Then Fact at index is retrieved and added to a new List<Fact>; tFacts and all these new List<Fact> are collected into new List<List<Fact> tList. This effectively transposes columns into rows.
Table 6.1. Old List<Fact<Fact>>
| List<Fact<Fact>> | Index 0 | Index 1 |
|---|---|---|
| List<Fact> for 2010 | Capital 200 | Reserve 150 |
| List<Fact> for 2011 | Capital 200 | Reserve 250 |
| List<Fact> for 2012 | Capital 210 | Reserve 300 |
Table 6.2. Transposed List<Fact<Fact>>
| Index 0 | Index 1 | Index 2 | |
|---|---|---|---|
| List<Fact> for Capital | Capital 200 | Capital 200 | Capital 210 |
| List<Fact> for Reserve | Reserve 150 | Reserve 250 | Reserve 300 |
Event wiring
ToolbarItem UiFactory in Snapshot.java wires the events.
in.fins.client.content/Snapshot.java
        @UiFactory
        public ToolbarItem toolbarItemFactory(String type, String category) {
                FinsResources images = FinsResources.INSTANCE;

....
                if (type.equals("popup")) {
                        DataGroupAction<FactGrid> dataGroupAction =
                             new DataGroupAction<FactGrid>(
                                        category, getFilter(category));
                        EventBus.get().addHandlerToSource(SymbolEvent.TYPE, this,
                                        dataGroupAction);

                        ToolbarItem tbi = new ToolbarItem(images.tablesheet());
                        tbi.addClickHandler(dataGroupAction);
                        // tbi.addClickHandler(factPopup);
                        tbi.setEventSource(dataGroupAction);
                        EventBus.get().addHandlerToSource(DataGroupEvent.TYPE,
                                        dataGroupAction, factGrid);
                        return tbi;
                }
                return null;
        }
FactGrid displays the data for a category for a range of dates, and this
sort of data is available from DataGroup, and DataGroupAction is
used to fetch DataGroup for a category. DataGroupAction handles the
SymbolEvent fired by SymbolAction and assign the Symbol to its
field for later reference. On pop-up ToolbarItem click, it fires
ClickEvent which is handled by DataGroupAction and it fetches the
DataGroup for the symbol/category and fires DataGroupEvent.
FactGrid handles the DataGroupEvent through handler method
onDataGroupChange().
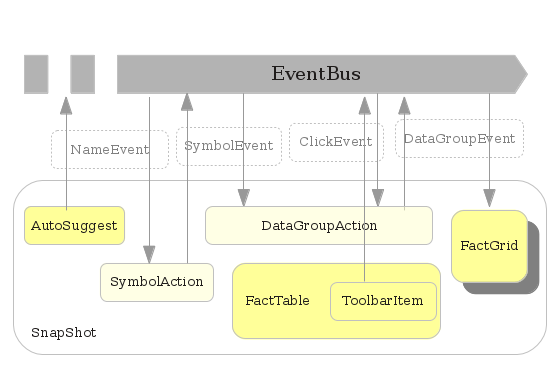
Figure 6.15. Events
Method onDataGroupChange() transforms the data and set it to DataGrid.
in.fins.client.widget/FactGrid.java
 public void setData(List<List<Fact>> factsList) {
        // fact at index 0 is duplicated
      // used as label for each row
      for (List<Fact> facts : factsList) {
            Fact labelFact = new Fact();
            labelFact.setKey("Label");
            labelFact.setValue(facts.get(0).getKey()); // key is used as label
          facts.add(0, labelFact);
        }
        dataGrid.setRowCount(factsList.size(), true);
        dataGrid.setRowData(0, factsList);
        dataGrid.clearTableWidth();
        dataGrid.redraw();
    }

    @Override
    public void onDataGroupChange(DataGroupEvent dataGroupEvent) {

        DataGroup dataGroup = dataGroupEvent.getDataGroup();
        log.fine("DataGroupEvent recd " + dataGroup);

        // reset factGrid
                int c = dataGrid.getColumnCount();
        while (--c >= 0) {
            dataGrid.removeColumn(c);
        }

        // first column to display the label
                addColumn("Item", HasHorizontalAlignment.ALIGN_LEFT, true, false);
        Column<List<Fact>, ?> ic = dataGrid.getColumn(0);
        ic.setHorizontalAlignment(HasHorizontalAlignment.ALIGN_LEFT);
        ic.setCellStyleNames("gwt-Datagrid-Cell-Watchlist");
        dataGrid.setColumnWidth(ic, "150px");

        // add other columns for each date and
      // add facts to List<List<Fact>>

        List<List<Fact>> factsList = new ArrayList<List<Fact>>();

        DateTimeFormat fmt = DateTimeFormat.getFormat("MMM yy");
        List<Date> dates = dataGroup.getDateList();
                for (int i = dates.size() - 1; i >= 0; i--) {
            Date date = dates.get(i);
            addColumn(fmt.format(date), HasHorizontalAlignment.ALIGN_RIGHT,                 true, true);
            // add facts for the date to List<List<Fact>>
          factsList.add(dataGroup.getData(date).getFacts());
        }

        // transpose and set data to dataGrid

        List<List<Fact>> tList = transpose(factsList);
                setData(tList);
                // set minimumTableWidth
        int rows = dataGrid.getRowCount();
        int cols = dataGrid.getColumnCount();
        dataGrid.setMinimumTableWidth(cols * 80, Unit.PX);
        if (rows < 7) {
            rows = 7;
        }
        if (cols > 7) {
            cols = 7;
        }

        // set width and height of parent panel
      String width = cols * 80 + "px";
        String height = rows * 35 + "px";
        Widget parent = getParent();
        parent.setSize(width, height);
                // if parent is popup show and center
      if (parent instanceof PopupPanel) {
            ((PopupPanel) parent).center();
        }
    }
Steps
| remove the existing DataGrid columns if any (which are created in the previous cycle). |
| add an indexed column to display the label. |
| obtain list of dates from DataGroup for which data is held and traverse the list. |
| for each date, add an indexed column and collect the List<Fact> in a List<List<Fact>>. |
| transpose the List<List<Fact>>. |
| call setData() method to set transposed List<List<Fact>> data to DataGrid. |
| based on the number of rows and columns, arrive width and height of DataGrid. |
| if parent panel is PopupPanel, then set its width and height and call center method to center and show the Popup. |


Width is set to a maximum of 7 columns and width is set to 7*80 px. In
case there are more than 7 columns, then DataGrid enables scrolling as
MinimumTableWidth is set to 7 columns.
In the next section, we complete the half done chart panel using Google Chart Tools.