9.2. WordPress Chart Page
In the next two blogs, we add a sub menu to Share on Social Plugin menu to display the share statistics with Google Charts API. The chart page uses functionalities already discussed in following topics.
The plugin uses two files admin/class-stats.php and js/chart.js. As
many of the concepts are already covered in the tutorial we will not get
into the detail, instead explain the overall flow with the relevant code
snippets.
Add Sub Menu Page
To add sub menu, Sos_Stats::setup() adds Sos_Stats::register_stats_page() to action hook admin_menu.
share-on-social/admin/class-stats.php
class Sos_Stats {

    public function setup () {
        add_action( 'admin_menu', array($this,'register_stats_page') );
    }
The action method, adds the sub menu Statistics to sos post type menu using the slug edit.php?post_type=sos.
share-on-social/admin/class-stats.php
    public function register_stats_page () {
        $menu_label = __( 'Statistics', 'sos-domain' );
        $page_title = __( 'Share on Social Statistics', 'sos-domain' );
        $stats_page = 'sos_stats_page';
        $page_hook_suffix = add_submenu_page( 'edit.php?post_type=sos',
                $page_title, $menu_label, 'administrator', $stats_page,
                array(&$this,'render_stats_page') );
        /*
         * link scripts only on a specific administration screen. see example:
         * Link Scripts Only on a Plugin Administration Screen in
         * http://codex.wordpress.org/Function_Reference/wp_enqueue_script
         */
        add_action( 'admin_print_scripts-' . $page_hook_suffix,
                array($this,'enqueue_chart_scripts') );
    }
Normally, plugins use wp_enqueue_scripts hook to enqueue scripts,
but here we use a dynamic hook so that chart scripts are added only to
plugins’ admin screens. The add_submenu_page() returns the slug of
newly added sub menu and we use that to add the Sos_Stats::enqueue_chart_scripts() method to action hook
admin_print_scripts-<menu slug>. Refer Link Scripts Only on a Plugin Administration Screen to known more about this.
Enqueue Scripts
Actual enqueue happens in Sos_Stats::enqueue_chart_scripts() method
which is called only when we click Statistics sub menu.
share-on-social/admin/class-stats.php
    public function enqueue_chart_scripts () {

        wp_enqueue_script( 'sos_google_api' );
        wp_enqueue_script( 'sos_chart_script' );

        ....
    }
We use script handles to enqueue, so we need to register them before they actually enqueue.
We do that in Sos_Stats::setup() where we add
Sos_Stats::init_chart_scripts() to admin_init action hook.
share-on-social/admin/class-stats.php
class Sos_Stats {

    public function setup () {
        add_action( 'admin_init', array($this,'init_chart_scripts') );
    }

....
In the action method, we register the two scripts
Google Chart API which draws the charts. The real benefit of using Google Chart API is that there is no need to install any chart library on the server.
Plugin script file
js/chart.jswhich is used to fetch chart data and draw the chart with Google Chart API.
share-on-social/admin/class-stats.php
    public function init_chart_scripts () {
        $google_api = 'https://www.google.com/jsapi';
        wp_register_script( 'sos_google_api', $google_api,
                array('jquery'), null, false );
        wp_register_script( 'sos_chart_script', SOS_URL . '/js/chart.js' );
    }
Render Chart Page
To render the page, add_submenu_page() used Sos_Stats::render_stats_page() method as the callback.
share-on-social/admin/class-stats.php
public function render_stats_page () {
$heading = __( 'Share Stats', 'sos-domain' );
echo <<<EOD
<h3>{$heading}</h3>
<div> </div>
<div id="summary_chart"></div>
<div> </div>
<div id="stats_chart"></div>
EOD;
}
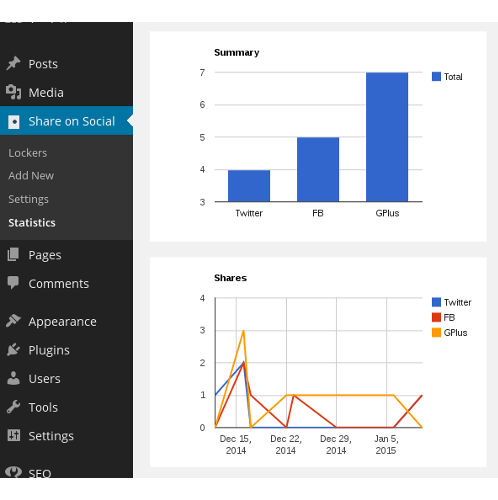
In the callback method, apart from the heading, we place two empty <div> elements as placeholders, where Google Charts API draws the charts. The <div> with id summary_chart is for the chart that shows total share for each Social network and the other one for the chart that shows share details by date.
Pass Data to Client
We also use Sos_Stats::enqueue_chart_scripts() method to pass data to
the js/chart.js using WordPress function wp_localize_script().
share-on-social/admin/class-stats.php
    public function enqueue_chart_scripts () {
        ....
        wp_localize_script( 'sos_chart_script', 'sos_chart',
            array(
                    'ajax_url' => admin_url( 'admin-ajax.php' ),
                    'stats_nonce' => wp_create_nonce( 'sos-get-stats' ),
                    'stats_summary_nonce' => wp_create_nonce('sos-get-stats-summary' ),
                    'summary_title' => __( 'Summary', 'sos-domain' ),
                    'stats_title' => __( 'Shares', 'sos-domain' )
            ) );
    }
Apart from the standard WordPress Ajax URL, we also pass title and nonce for the two charts.
In the next section, we use WordPress Ajax to fetch the data from the server and draw chart with the Google Chart API.