9.3. WordPress Google Charts
In the previous blog, we setup a new sub menu page to display the charts and enqueue Google Chart API scripts. In this blog, we explain the steps to load Google Chart API, fetch chart data with Ajax and draw WordPress Google Charts.
Load Google Charts API
Google Charts is a versatile package to present data as charts. It is robust and provides large number of ready to use chart types. Google Chart script is dynamically loaded from Google servers which eliminates the need to install chart software on the WordPress server.
The script js/chart.js, loads Google Charts API and its corechart
package and sets drawChart() function as callback.
share-on-social/js/chart.js
google.load('visualization', '1', {
    'packages' : <a href="https://developers.google.com/chart/interactive/docs/reference#dataparam" target="_blank"> 'corechart' ]
});

google.setOnLoadCallback(drawChart);

function drawChart() {
    drawSummaryChart();
    drawStatsChart();
}
This will fetch Google Chart API and corechart package from Google
servers. Once API is loaded, the callback function drawChart() is
invoked which calls functions to draw Summary chart and Stats chart. We
will step through the Summary Chart to understand the flow.
Fetch Chart Data using WordPress Ajax
On the server side, Sos_Ajax::setup() method registers
Sos_Ajax::get_stats_summary() method as the callback to action hook
wp_ajax_get-stats-summary.
share-on-social/admin/class-ajax.php
class Sos_Ajax {

    public function setup () {
        ....
        add_action( 'wp_ajax_get-stats-summary',
                array($this,'get_stats_summary') );
    }
When chart.js makes an Ajax call with action as get-stats-summary,
WordPress Ajax script wp-admin/admin-ajax.php invokes
Sos_Ajax::get_stats_summary().
After linking Ajax handler on server side, we make Ajax call in the
function drawSummaryChart() to fetch chart data.
share-on-social/js/chart.js
function drawSummaryChart() {
    var jsonData = jQuery.ajax({
       type : 'POST',
       url : sos_chart.ajax_url,
       dataType : "json",
       data : {
         action : 'get-stats-summary',
         _ajax_nonce : sos_chart.stats_summary_nonce,
       },
       async : false
     }).responseText;

    ....
Client uses jQuery.ajax() function to make Ajax call with following
parameters. It uses some of the data passed by the server earlier
through sos_chart variable.
type - use POST type for the call.
url - URL of the WordPress Ajax routing script
wp-admin/admin-ajax.php.dataType - call returns JSON data.
data:action - use get-stats-summary as Ajax action name which we have linked to Ajax method
Sos_Ajax::get_stats_summary()through action hook wp_ajax_get-stats-summary._ajax_nonce - WordPress security token to ensure that only the designated client makes the call.
When WordPress Ajax routing script admin-ajax.php receives the call, it
invokes Sos_Ajax::get_stats_summary() method to handle the request.
share-on-social/admin/class-ajax.php
    public function get_stats_summary () {
        $valid_req = check_ajax_referer( 'sos-get-stats-summary', false, false );
        if ( false == $valid_req ) {
            wp_die( '-1' );
        }
        $data = $this->get_stats_summary_json();
        wp_die( $data );
    }
The method, first checks whether it is a valid Ajax request originated from indented client by using the security token nonce. If not, then call terminates and returns -1 to client. If security check goes through then it obtains summary stats as JSON string and returns it to the client.
Google Chart Data JSON
The WordPress Option sos_stats_summary holds the stats summary and
Sos_Ajax::get_stats_summary_json() fetches the data and constructs an
array out of it. The data array is encoded as JSON using PHP function
json_encode() and returned.
share-on-social/admin/class-ajax.php
    function get_stats_summary_json () {

        // add cols to data
        $data = array();
        $data[ 'cols' ][] = array(
                'label' => __( 'Share On', 'sos-domain' ),
                'type' => 'string'
        );
        $data[ 'cols' ][] = array(
                'label' => __( 'Total', 'sos-domain' ),
                'type' => 'number'
        );

        // get summary stats and if no found then return just cols
        $summary = get_option( 'sos_stats_summary' );
        if ( false == $summary ) {
            return json_encode( $data );
        }

        // from summary create and add rows to data
        foreach ( $summary as $key => $value ) {
            $row = array();
            $row[][ 'v' ] = $this->get_label( $key );
            $row[][ 'v' ] = $value;
            $data[ 'rows' ][][ 'c' ] = $row;
        }

        return json_encode( $data );
    }
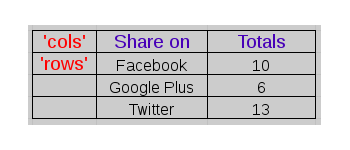
The assoc array, $data, uses index ‘cols’ to set two columns Share on (Social Media name) and Total and their data types - string or number. Next, we scroll through the option data $summary and construct rows. The index ‘rows’ holds rows of data as cells (c) and each cell holds values (v) for each social media - name and total. Refer [DataQuery JSON to know more about the data format.
Draw Chart
The function drawSummaryChart() uses JSON data to draw the chart.
share-on-social/js/chart.js
function drawSummaryChart() {
    ....
    var data = new google.visualization.DataTable(jsonData);

    var chart = new google.visualization.BarChart(document.getElementById('summary_chart'));

    var options = {
       title : sos_chart.summary_title,
       orientation : 'horizontal',
       width : 500,
       height : 400
    };

    chart.draw(data, options);
}
From JSON data, it constructs DataTable object. Next, it creates a BarChart object and attaches <div id=‘summary_chart’></div>, the
empty placeholder to render the chart set in the previous blog. The
chart options such as orientation, width, height etc., are set in
options object. Finally, chart.draw() function draws the chart
with the data and options as parameter.
The second chart, Shares, is displayed in the similar way, but uses Line Chart to present the Shares by date.
The next chapter explains the steps to internationalize the plugin.